Google Cloud Platform Flow Logs
Enable Google Cloud VPC Flow Logs in the Console or Terraform so Coordimap can visualize service-to-service network traffic and attach flows to the correct scope_id.
Enabling GCP VPC Flow Logs for Coordimap Network Visualization
To unlock the full potential of Coordimap's infrastructure diagramming for your Google Cloud Platform (GCP) environment, you can enable VPC Flow Logs. These logs capture information about IP traffic flowing between network interfaces within your VPC network.
By enabling VPC Flow Logs and configuring the Coordimap agent to use them with gcp_flows: "true" in your GCP data source configuration, Coordimap can ingest this data and automatically visualize the communication paths between your GCP resources, such as Compute Engine instances. This gives you a much clearer view of how systems interact inside the same GCP environment.
This guide explains how to enable VPC Flow Logs in your GCP project using either the Google Cloud Console or Terraform.
Why Enable Flow Logs for Coordimap?
- Visualize Network Traffic: See exactly which resources are communicating within your VPC.
- Understand Dependencies: Identify implicit network dependencies between services.
- Troubleshoot Connectivity: Gain insights into network paths when diagnosing issues.
- Enhance Security Analysis: Observe traffic patterns for security monitoring (though Coordimap focuses on visualization).
scope_id And External Mappings
If you use GCP flow logs together with Kubernetes discovery, make sure your mappings refer to the Kubernetes cluster by its Kubernetes scope_id, which is the cluster UID.
This is a subtle but important point. Flow records and discovered infrastructure are joined through stable upstream identities. If your external mappings point at a different value, Coordimap will treat the traffic and the Kubernetes assets as different scopes.
Example Kubernetes cluster UID lookup:
kubectl get namespace kube-system -o jsonpath='{.metadata.uid}'For the full identity model, see Shared Configuration Options.
Enabling Flow Logs via Google Cloud Console
You can enable VPC Flow Logs when creating or editing a subnet within the Google Cloud Console:
- Navigate to VPC network > VPC networks in the Google Cloud Console.
- Select the VPC network containing the subnet you want to configure.
- Click on the Subnets tab.
- Either click Add subnet to create a new one or click the name of an existing subnet to edit it.
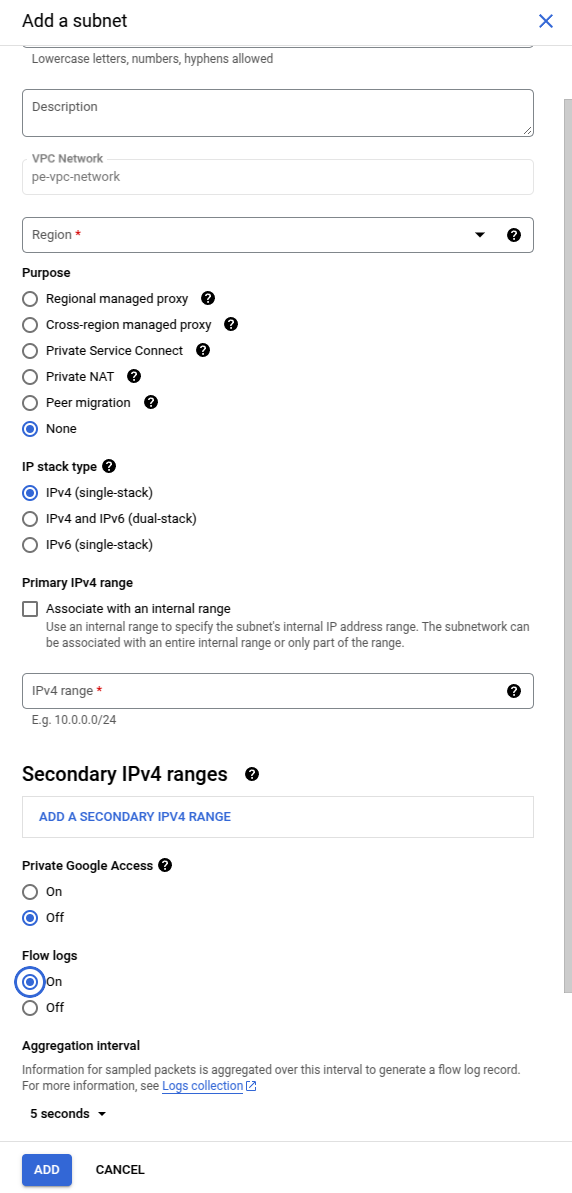
- Scroll down to the Flow logs section.
- Toggle Flow logs to On.
- Configure the Aggregation interval (e.g., 5 seconds). Shorter intervals provide more granular data.
- Optionally adjust the Sample rate (1.0 means 100% of packets are sampled).
- Crucially for Coordimap: Under Metadata, select Include all metadata. This ensures the agent receives all necessary information to map flows correctly.
- Configure any Filter expression if needed (default
truelogs all traffic). - Save your changes.
Enabling Flow Logs via Terraform
If you manage your GCP infrastructure using Terraform, you can configure VPC Flow Logs directly within your google_compute_subnetwork resource definition.
First, define your VPC network if you haven't already:
resource "google_compute_network" "vpc_network" {
  name                    = "vpc-network"
  auto_create_subnetworks = false
  mtu                     = 1460
  routing_mode            = "REGIONAL"
}
Next when creating a subnet of the vpc-network you need to define the log_config section. It is advisable to include all metadata by setting the INCLUDE_ALL_METADATA flag.
In this way the Coordimap agent can deal with all the needed mappings. In order to make the right decisions on what values to use when configuring the logs please refer to the
Terraform documentation of the vpc_network_subnet
resource "google_compute_subnetwork" "vpc_network_subnet" {
  name                     = "vpc-subnet"
  ip_cidr_range            = "10.0.0.0/16"
  region                   = "europe-west3"
  network                  = google_compute_network.vpc_network.id
  private_ip_google_access = true

  log_config {
    flow_sampling        = 0.5
    aggregation_interval = "INTERVAL_5_SEC"
    metadata             = "INCLUDE_ALL_METADATA"
    filter_expr          = "true"
  }
}
Next Steps
- Enable Flow Logs: Use either the Console or Terraform method described above for the relevant subnets in your GCP project.
- Configure Coordimap Agent: Ensure the
gcp_flowsoption is set to"true"in the configuration block for your GCP data source within the Coordimap agent's YAML file. See the GCP Configuration Guide. - Restart Agent: If you modified the agent configuration, restart the agent.
- Verify Visualization: Allow some time for logs to be generated and for the agent to crawl and process them. Check your Coordimap diagrams to see network flow lines appearing between your GCP resources.
Creating an AWS Read-Only IAM User for Coordimap
Create an AWS IAM read-only user and access keys for the Coordimap agent to discover cloud resources without write permissions.
Google Cloud Platform Configuration
Configure Coordimap for Google Cloud with the correct scope_id, service account credentials, crawl settings, and optional VPC Flow Logs.